It might happen to you: the case of the Slovenian Parliamentary Elections 2011
The research industry may be less ‘sexy’ than it’s cousin industries; advertising, design, PR, consulting. We don’t have festivals, ‘Research Men’ TV serials and there are few movies with researchers taking main roles. However, there are rare moments when we gain a lot of attention, when everyone is looking towards us and our results – this is during elections.
For the research industry this can be the moment when the whole industry gains or loses credibility. It can have an enormous effect on the reputation of the research industry in boardrooms and on (already dropping) response rates. It also provides the opportunity for research companies to gain awareness and test new approaches. But, whatever happens by the end of Election Day the entire country will be comparing your polling results with the real results. What can we do when we know that the pre-election surveys results and election results are going to vastly differ?
Tactical voting
There have been a lot of research papers written about the effects of public opinion polls on turnaround and tactical voting is one of them. Tactical (or strategic) voting occurs when public voters back an insincere choice in order to prevent an undesirable party from taking control. Tactical voting is a relatively new phenomena; the oldest known examples are date back to 1997.
In 2011, the Slovenian parliamentary pre-election polls consistently predicted an easy win for Janez Janša, the candidate of the SDS – Slovenian Democratic Party, traditionally a right-wing party. However, his opponent, Zoran Janković, the candidate for the PS – Positive Slovenia, a left wing political party established only 50 days before elections, won. Post-elections survey conducted by Valicon showed that 30% of voters voted tactically. Such a high proportion of tactical voting is unprecedented.
The indicators
Can such a high proportion of tactical voting occur at your next general election? We identified a number of factors that can predict a rise in tactical voting:
1.Higher number of political parties;
2.High polarisation of voters (i.e. left/right);
3. High similarity of political parties;
4. Low party loyalty;
5. Low satisfaction with democracy;
6. Low satisfaction with political parties.
According to our experience in previous elections, we had projected tactical voting may well occur in 2011, but we did not predict to what extent it was recorded last year.
Preparing for a “flop”
The key issue when dealing with tactical voting of this magnitude was preparing the public for such different results than the polls showed before the elections and providing evidence of the occurrence of tactical voting. Traditional methodologies include tracking-polls with trend analysis until the last possible moment, and post-election surveys. Tracking-polls showed a turbulent week before the elections with the PS gaining and the SDS losing support. The tracking-poll results from Friday evening were showing tight results. These results were distributed by non-traditional media only. It was important that these results were not considered when media compared election results with pre-election polls. Traditional post-election surveys using the same methodology as pre-election surveys explain alot. The most important result is shown with the analysis of the question “who were they were voting for”. Matching that question with the result of post-election survey and actual results is
the key evidence.
The Migration Poll
As mentioned before, this was not the first result “flop” in election polling to occur in Slovenia. Since 2003 we have been observing the rise of those making decisions in last few days. In 2007 we developed a methodology to explain the migration of voters from party to party in the last week. We call it, for obvious reasons, the Migration Poll. The methodology is based on a combination of telephone surveys and double web surveys using access-panels:
1. Telephone surveys were conducted in the last 3 days for the public release of last results (usually Mon-Wed). We used a traditional voting question “if today would be election day…”, and a few additional questions for the undecided; probability of switching, secondary choice, probability of going to elections. This survey was used for weighting purposes.
2. In the same period we run a web survey with the same questions adding additional questions using concrete lists with names, as they were used in the polling station.
3. On Sunday (the day after voting finished) we asked the same respondents from the Wednesday survey, who they were really voting for, why, when did they make the decision, were they really voting for their preferred choice or did they vote against a party.
This year’s Migration poll was based on 1421 respondents that answered the survey both on Wednesday (30.11.2011) and Sunday (4.12.2011). Some of the results of 2011’s Migration poll:
● 30% of respondents voted tactically;
● 15% of respondents decided on whom to vote for on Sunday;
● 28% (cumulative) of respondents decided who to vote for in last few days.
The key to the Migration Poll is migration analysis. The result is presented as a network where political parties (and undecided) represent nodes while migrations in last week from one node to another represent arcs. Only migrations of 0.5% and more are presented in chart. Arcs with higher values have higher weight. For example, the arrow from the SDS (the party that were leading in pre-election polls) to undecided node represent 3.1% of respondents that answered that they would vote for SDS on Wednesday, but at the end they did not vote on Sunday.
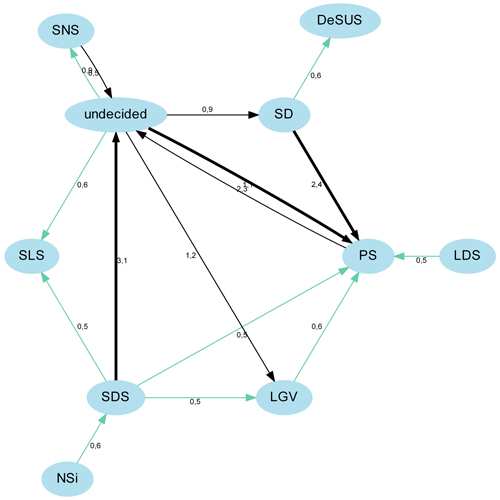
What can we see from the network?
● Left-wing voters were activated – they actually visited the polling stations, while the right-
wing voters stayed at home;
● There were further movements, with migration towards PS (from LDS and SD, both left-wing
parties) and migrations from SDS to other right-wing parties (LGV and SLS), but also to PS;
● The last migration is the most interesting one – it represents right-wing voters who decided
to vote for the left-wing candidate.
What can we learn from the Slovenian case?
With the decline of trust in democracy, political parties, and governments, we can expect that new political parties will emerge. Of course, the type of tactical voting differs according to the political system, but still, where there is a possibility for it our experiences in Slovenia may help.
Explaining tactical voting is hard
It is not just hard – it is extremely hard. It needs time to be explained, it needs certain knowledge at the receiver’s side and it is much more complicated than a simple comparison of results.
It is about media and their preference for sensation.
Media outlets are often not interested in deep explanations of what is happening with the voters. They are interested in simple numbers, shares, and maybe trends. They are interested in sensational stories with negative connotations. For example, when deciding between the message “polls were wrong, who still believes in polls?” vs. “pollsters explain how tactical voting
occured”, they will more often than not choose the former. And that was consistent in our experience of the media. A Slovenian primary business newspaper conducted a survey among biggest companies after the results to ask whether those companies will still order market research after the perceived “flop”.
There are many “stakeholders” involved.
The perception of the results by the general public is obviously important, but they are only one of the many “stakeholders” that use and distribute the polling results:
● research agencies CEOs;
● public opinion researchers;
● political commentators;
● journalists and editors;
● key marketing personalities;
● key managers;
● politicians;
● key associations: manager’s associations, marketing associations, PR associations.
Some are opinion makers and therefore can be thought of as more important in terms of message distribution. Some are crucial for the research industry (e.g. key marketing personalities, key managers). But they are all connected; key marketing personalities were asked about their attitude towards marketing research, if they were unprepared they could be used as a source that would later support a negative campaign against the market research industry. The most important part is that, in such moments, the research industry must be united. The industry compiled all the evidence and prepared a press conference together with the Slovenian Marketing Association. We accompanied that with the use of social media, establishing our“Pollboy” blog-site, looking at polling research and predictions (http://zenelbatagelj.wordpress.com/) which had more than 15,000 visitors across the first two days.
The evidence that really matters is migration analysis from the Migration poll.
It turned out that migration analysis was the most convincing evidence of what really happened
on Election Day. With some hard work almost all involved stakeholders understood the
explanation and used it when interpreting the results of the elections.
Need for new consensus within polling industry – what is our output: Measurement vs. Prediction
WAPOR/ESOMAR’s Guidelines for conducting pre-election polls and polls on voting intentions address the “predictive” understanding of polls. The second objective states:
“These guidelines aim to protect the public reputation of market research using sample surveys. Pre-election opinion polls which are published in the final days of an election campaign have a major influence on this. While it is true that opinion polls are a snapshot of intentions at a specific point of time, they are inevitably seen as predictions of the election result when they are published late in the campaign. In general, pollsters have not effectively challenged this use of polling data, partly because the track record of the polls in “predicting” the result is good.”
But with the rise of tactical voting the polling industry is dealing with two different subjects. Measurement of current political preferences (snapshot of intentions) and a prediction of what will happen on Election day. In most cases these are the same or similar, but this is increasingly not the case.
Some post-analysis of data gathered during the last week of elections using more advanced methods (maxdiff) gave correct ranking for the first two parties. At first sight it seems that advanced methods that also include tactical voting momentum should be used by pollsters. But, that could be dangerous for the credibility of the whole industry; imagine the case of Slovenian elections, with the media publishing completely different results. The majority of results show a pure description of the current situation using standard sets of survey questions, showing clear win for SDS, and very few of them would show the predictive results of PS winning.
The danger lies in the interpretation of different results obtained by two different approaches. That could be easily negatively marked as manipulation and lack of objectivity. To avoid such dangers, the national polling industry needs a clear agreement on what is the output –
measurement or prediction?
We are close to the instrument that predicts the probability of tactical voting
There are not so many cases where tactical voting happens to such a great extent. It seems that the Slovenian case is the first well documented case in polling history. The probability of tactical voting is some kind of new possible source of error estimate. This new error should become a common part of interpretation of last polling results before elections.
More information:
Valicon d.o.o.
Kopitarjeva 2, Ljubljana
T. 01/ 420 49 00 (Zenel Batagelj, partner)
F. 01/ 420 49 60
E.[email protected]
W. www.valicon.net